Ayesha Yaqoob,
Mahmood Ahmad ![]() ,
Rai Muhammad Sarfraz,
Asif Mahmood
,
Rai Muhammad Sarfraz,
Asif Mahmood
For correspondence:- Mahmood Ahmad Email: ma786_786@yahoo.com Tel:+923009682258
Received: 28 April 2016 Accepted: 14 September 2016 Published: 31 October 2016
Citation: Yaqoob A, Ahmad M, Sarfraz RM, Mahmood A. Optimization and validation of high performance liquid chromatography-ultra violet method for quantitation of metoprolol in rabbit plasma: application to pharmacokinetic studies. Trop J Pharm Res 2016; 15(10):2245-2252 doi: 10.4314/tjpr.v15i10.25
© 2016 The authors.
This is an Open Access article that uses a funding model which does not charge readers or their institutions for access and distributed under the terms of the Creative Commons Attribution License (http://creativecommons.org/licenses/by/4.0) and the Budapest Open Access Initiative (http://www.budapestopenaccessinitiative.org/read), which permit unrestricted use, distribution, and reproduction in any medium, provided the original work is properly credited..
Purpose: To develop a sensitive, simple and validated high performance liquid chromatography (HPLC) analytical method for the determination of metoprolol tartrate in rabbit plasma.
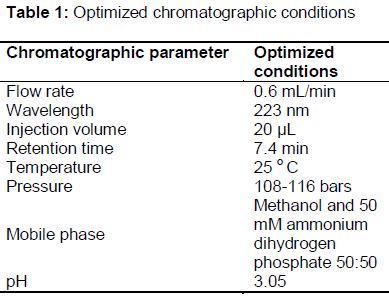
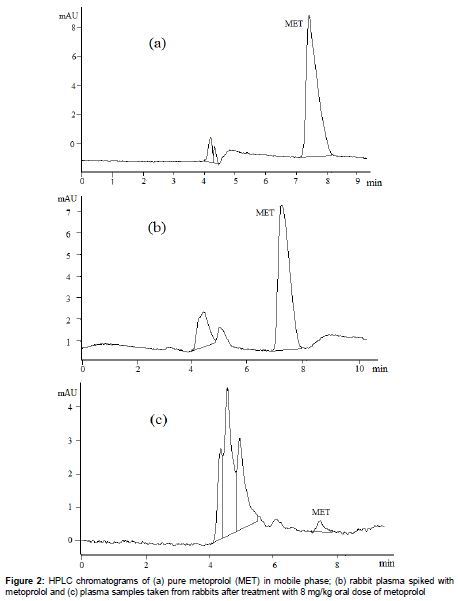
Methods: Mobile phase of methanol and 50 mM ammonium dihydrogen phosphate solution (50:50) at pH 3.05 was used for separation of metoprolol on BDS hypersil C18 column at a wavelength of 223 nm. Flow rate and retention time were 0.6 mL/min and 7.4 min, respectively. For pharmacokinetic study, rabbits were given an oral dose of 8 mg/kg of metoprolol in solution form. Blood samples were taken from jugular vein of the rabbits after drug administration and analysed by HPLC.
Results: Separation of metoprolol was not interfered with other components in plasma. The calibration curve was linear in the range of 25 - 1000 ng/mL (r2 = 0.997). Lower limits of detection (LLOD) and quantitation (LLOQ) were 8.87 and 25 ng/mL, respectively. Relative standard deviation (RSD) of intra-day and inter-day precision was < 14.27 and 7.61 %, respectively. Relative error of accuracy was between 4.85 and 14.37 %. Maximum plasma concentration (Cmax), time to maximum plasma concentration (Tmax) and half-life (t½) after metoprolol oral administration in rabbits were 186.29 ng/mL, 0.50 h and 2.27 h, respectively.
Conclusion: A simple, accurate and precise HPLC-UV method for metoprolol determination in rabbit plasma has been successfully developed and applied to a pharmacokinetic study.
Introduction
Metoprolol tartrate is a selective β1-adrenergic blocking agents used for management of angina pectoris and treatment of mild to moderate hypertension. Metoprolol is supplied as a racemic mixture of S and R enantiomers. Metoprolol is absorbed up to 95 % but undergoes intensive first pass metabolism after oral administration with bioavailability of 40 to 50 %. It has half-life of 3 - 7 h. Time to reach peak plasma concentration (Tmax) is 1-2 h in human [1,2].
Selective β 1 activity of metoprolol is proportional to its plasma concentration thus sensitive method of analysis is required for its quantification in plasma. Several HPLC methods are available for Metoprolol quantification in plasma, urine and pharmaceuticals [3-6]. Most of them used mass spectrometer and florescent detector. A few of those methods used ultraviolet (UV) detectors. Present HPLC method utilizes UV detector as it is easily available, affordable and convenient and requires less maintenance [7-10]. Liquid-liquid extraction, solid-phase micro-extraction and solid-phase extraction are commonly used for the preparation of biological samples. Most of these methods require various steps for the extraction of metoprolol from blood samples [11,12]. Aim of present study was to develop a sensitive, precise, accurate and simple HPLC-UV method for metoprolol determination in plasma and investigate its application for pharmacokinetic study in rabbits.
Methods
Materials
Metoprolol tartrate was a gift from Acto Laboratories Limited, Pakistan. HPLC grade acetonitrile and methanol were purchased from Merck (Germany). Analytical grade dichloromethane was purchased from Fisher Scientific (UK). Ammonium dihydrogen phosphate was purchased from AppliChem (Germany). Ortho phosphoric acid (analytical grade) was procured from Merck (Germany). Distilled water was freshly prepared on a distillation plant (WDA/4 R & M, England). Microfilters of 0.45 micron were purchased from Millipore (Merck, Germany). All other chemicals and reagents used were of analytical grade.
Method development
Instrumentation and chromatographic conditions
HPLC apparatus used in present study was from Agilent Technologies series 1100 (USA) with a pump and variable wavelength detector (VWD). Chromatographic data was processed by computerized integration software hp ChemStation. Chromatographic separation was achieved on BDS hypersil C18 column (250 × 4.6 mm, particle size 5.0 µm, Thermo electron, USA). . During optimization of chromatographic conditions a number of mobile phases were tested comprising of various ratios of acetonitrile, methanol, water and buffer solutions [7]. Buffer solutions of ammonium dihydrogen phosphate, potassium dihydrogen phosphate, disodium hydrogen phosphate, ammonium acetate, sodium dihydrogen phosphate were used in concentrations of 25, 50, 100 and 250 mM with methanol and acetonitrile in order to achieve an optimum separation of metoprolol [3,5,6]. Wavelength for maximum absorbance was confirmed on UV-Visible spectrophotometer (IRMCO, U2020) for 10 µg/mL solution of metoprolol in respective mobile phases. The pH of mobile phase was altered within 2.5 – 8.0 using orthophosphoric acid. Finally, mobile phase consisting of Methanol and 50 mM ammonium dihydrogen phosphate solution in ratio of 50:50 at pH 3.05 was used. The overall chromatographic conditions are summarized in .
Mobile phase preparation
Solution of ammonium dihydrogen phosphate (50 mM) was prepared in fresh distilled water and combined with methanol in ratio of 50:50. The pH of mixture was adjusted to 3.05 by orthophosphoric acid while monitoring with a pH meter (WTW pH 300, Germany). Prepared mobile phase was then filtered through 0.45 µm Millipore filter by vacuum filtration assembly (Rotary Vane Pump ILMVAC, Germany).
Stock solution
Stock solution of metoprolol was prepared in concentration of 1 mg/mL in filtered mobile phase. Serial dilutions were prepared in mobile phase from that stock solution during process of achieving symmetric peaks of drug. For spiking of rabbit plasma, both of stock solution and serial dilutions of metoprolol were prepared in filtered distilled water. Stock solutions were prepared on daily basis.
Plasma spiking
Blank blood was obtained from the jugular vein of the white albino rabbits. Plasma was separated by centrifugation. Blank Plasma was stored at -20 oC in order to use during optimization and validation of HPLC method. Blank plasma (0.5 mL) was spiked with 0.5 mL of serial dilutions of metoprolol (in filtered distilled water) to produce the plasma concentrations of 1000, 750, 500, 300, 100, 50 and 25 ng/mL for construction of calibration curve.
Liquid-liquid extraction for plasma samples preparation
Single step, Liquid-liquid extraction method was used for preparation of plasma samples for HPLC analysis. For extraction of metoprolol, 1 mL spiked plasma was taken in 12 mL glass centrifuge tube along with 100 µL of 2 N NaOH solution and mixed on a vortex mixer (Seouline BioScirnce, Korea) for 5 s. Dichloromethane (6 mL) as extracting solvent) was added and mixed immediately for 5 min in vortex mixer at speed of 1200 rpm/min. After mixing, the mixture was centrifuged for 5 min at a speed of 5000 rpm. The lower organic phase of dichloromethane was separated carefully and transferred to another glass test tube and evaporated under a gentle stream of nitrogen at 40 oC on sample concentrator. After drying, the residue was reconstituted with 200 µL of mobile phase and mixed on vortex mixer for 1 min at a speed of 2500 rpm/min. 20 µL of sample was injected into HPLC system by using 100 µL glass syringe in fixed-loop injector.
Validation of method
Validation in present study was performed by determination of linearity, lower limit of detection (LLOD), lower limit of quantitation (LLOQ), accuracy and precision according to standards of FDA’s guidance for industry for bioanalytical method validation [13].
Linearity and calibration
Linearity of an HPLC method is its ability to obtain peak area of drug in direct proportion to the drug concentration. For construction of calibration curve spiked plasma in concentration range of 25-2000 ng/mL was extracted by following the procedures stated above and assayed. Calibration curve was prepared by plotting area of metoprolol peaks in chromatograms against concentration of drug in spiked plasma. Linearity was established by regression analysis of calibration curve.
Precision and accuracy
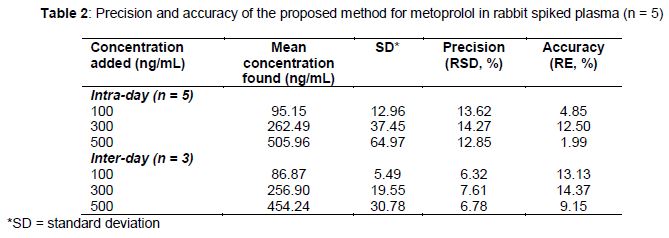
Precision and accuracy was determined by repeatability and intermediate precision. Precision and accuracy of this method was evaluated at three different levels i.e. 100, 300 and 500 ng/mL. Dilutions were prepared by using stock solution (1 mg/mL) of metoprolol in water.
For repeatability (intra-day precision) five replicates of three concentrations were analyzed in a single day. For intermediate precision (inter-day precision) single samples of three different concentrations were analysed for three days [4]. Precision was calculated as percentage of relative standard deviation (RSD, %). Accuracy was calculated as a percentage of relative error (RE, %) [8].
Precision = RSD (%) = {(SD/C1)}100 ......... (1)
Accuracy = RE (%) = {(C1-Co)/Co}100 ........ (2)
where Co is concentration added, C1 the concentration found and SD is standard deviation.
Sensitivity
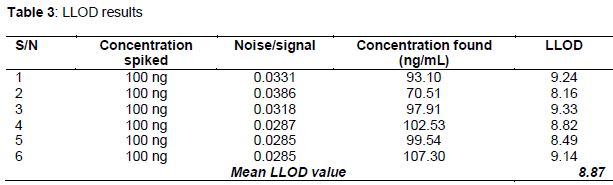
Sensitivity of HPLC method was established by determining its lower limit of detection (LLOD) and lower limit of quantitation (LLOQ). LLOQ is the minimum concentration of drug that can be quantitated with acceptable precision and accuracy (i.e., RSD and RE < 20 %) [14,15] whereas LLOD is concentration that can be detected but not quantitated.
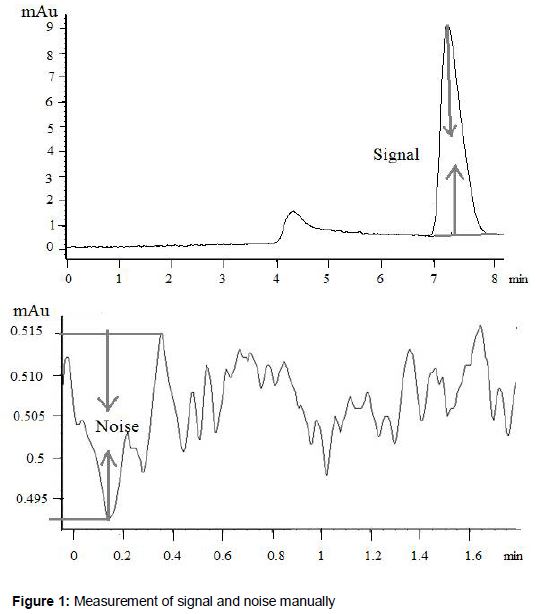
Determination of LLOQ and LLOD was done on the basis of signal to noise ratio. LLOD and LLOQ are the drug plasma concentrations at which signal/noise is equal to 3 and 10, respectively. This method is only applicable for procedures where noise is present in base line and where lowest concentration of drug in chromatogram can be distinguished from chromatogram of blank plasma. In present case, both conditions were fulfilled. Signal to noise ratio can be obtained from integration system and can also be measured manually. In the present study, signal to noise ratio was calculated manually. An example of measurement of noise and signal manually is shown in .
LLOD was calculated by using following equation [16,17].
LLOD = (3N/S)C1…..................................... (3)
where C1 is the concentration found, N is noise and S is signal.
Application of developed method to pharmacokinetic studies
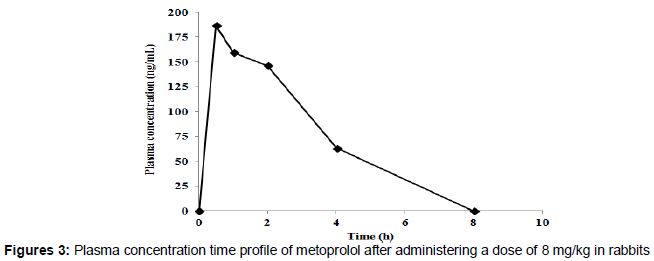
Developed method was applied for quantification of metoprolol in rabbits. The study was approved by Pharmacy Research Ethics Committee (PREC), the Islamia University of Bahawalpur, Pakistan, (Ref. No. 61-2013/PERC). The study was performed in accordance with international guidelines for animal studies [18]. Rabbits (n = 5) were fasted overnight but were given free access to water. Rabbits were given a dose of 8 mg/kg metoprolol in form of oral solution and blood sample were taken at time points of 0, 0.5, 1, 2, 4 and 8 h. Plasma from blood was separated by centrifugation and stored at -70 oC in an ultra-freezer (Sanyo, Japan). Before analysis on HPLC, plasma samples were allowed to warm at room temperature and then extracted by following same procedure as adopted for spiked plasma. Metoprolol concentrations in rabbit plasma were calculated from the calibration curve. Pharmacokinetic parameters were calculated for each subject using scientific application package, Kinetica® version 5.0 (Thermo Fisher Scientific, USA).
Results
Optimized method
A number of mobile phases were tested comprising of various ratios of acetonitrile, methanol, water and buffer solutions. Finally, the mobile phase consisting of methanol and 50 mM ammonium dihydrogen phosphate was selected because of symmetry of drug peak, sensitivity and reasonable retention time. Representative chromatograms are shown in . The figure showed that separation of metoprolol peak was not interfered by other components in plasma.
Linearity of calibration curve
Calibration curve was found linear in range of 25 - 1000 ng/mL with a correlation coefficient (R) of 0.997. The slope of the calibration curve was 0.1815 and regression equation was y = 0.1815 x + 1.3466.
Precision and accuracy
Based on the results shown in , precision (RSD) and accuracy (RE) were in the range of 12.85 to 14.27 % and 6.32 to 7.61 %, respectively.
Application of developed method to pharmacokinetic studies in rabbits
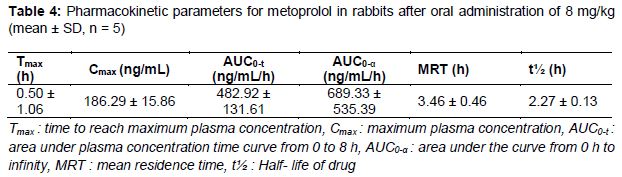
Plasma concentration versus time profile of metoprolol after oral administration is shown in . Non-compartmental approach was used for calculation of pharmacokinetic parameters. Pharmacokinetic parameters are given in . Half-life of metoprolol (t½) was 2.27 ± 0.13 h, AUC0-α was 689.33 ± 535.39 ng/mL/h and Cmax was 186.29 ± 15.86 ng/mL.
Sensitivity
LLOD as calculated from signal to noise ratio is given in . LLOD was found 8.87 ng/mL whereas LLOQ was 25 ng/mL.
Discussion
The quality of developed HPLC method depends on purpose of separation of analyte, ease in extraction, sensitivity, precision and accuracy, time of analysis and cost of chemicals. Selection of the right mobile phase for separation of metoprolol on column was dependent on peak symmetry and a reasonable retention time so that the drug peak should not interact with plasma peaks. During pH setting of mobile phase it was observed that higher pH provided less sensitivity and asymmetrical peaks. Thus, a pH range of 2.5 – 4.0 was selected for the investigation. From the number of buffers used, ammonium dihydrogen phosphate and potassium dihydrogen phosphate provided the required symmetry of peaks. The main problem in method development was height and area of drug peak in chromatogram. Initially combination of ammonium dihydrogen phosphate buffer with acetonitrile provided required symmetry and sensitivity. However, retention time in that method was short. Due to that short retention time, plasma peak interfered with metoprolol. Further trials were performed for ammonium dihydrogen phosphate and methanol combination. Finally, the selected mobile phase provided the required sensitivity and chromatographic separation with reasonable retention time with total run time of 10 min.
During optimization of chromatographic conditions, temperature was changed between 25 to 40 oC. Changes in temperature did not affect the resolution of peak. But decrease in the column pressure was observed with increase in temperature.
Metoprolol is very soluble in water and is freely soluble in alcohol, chloroform and dichloromethane, thus selection of extracting solvent was difficult. During process of liquid-liquid extraction, a number of methods were employed for effective plasma extraction by using n-hexane, chloroform and dichloromethane as extracting solvents. Finally, dichloromethane was selected for maximum extraction. During extraction procedure, solution of 2 N NaOH was added to neutralize dichloromethane. The calibration curve constructed by spiking rabbit plasma with metoprolol was linear in the range of 25 - 2000 ng/mL. In the present HPLC method, precision and accuracy were both < 15 % which are in compliance with FDA criteria [13].
Conclusion
A sensitive and simple HPLC-UV method has been developed and validated for metoprolol determination in rabbit plasma. A single-step liquid-liquid extraction procedure for sample preparation was adopted and metoprolol peak separation was not interfered with other components of plasma. The developed method has been successfully applied to pharmacokinetic studies of metoprolol in rabbits.
Declarations
Acknowledgement
References
Archives


News Updates